
Organize your data without code
For years analytics has been limited to what your IT department can accomplish with a data warehouse. No more. Aggregate and share data with any stakeholder in your business in three simple steps.

1. Connect your data sources
Get the full scope of your business through automated data integrations. Connect as many integrations as you’d like without any code.
Don’t see your integration? Use the document reader to upload any CSV, XLSX, PDF, or PNG data table with ease.
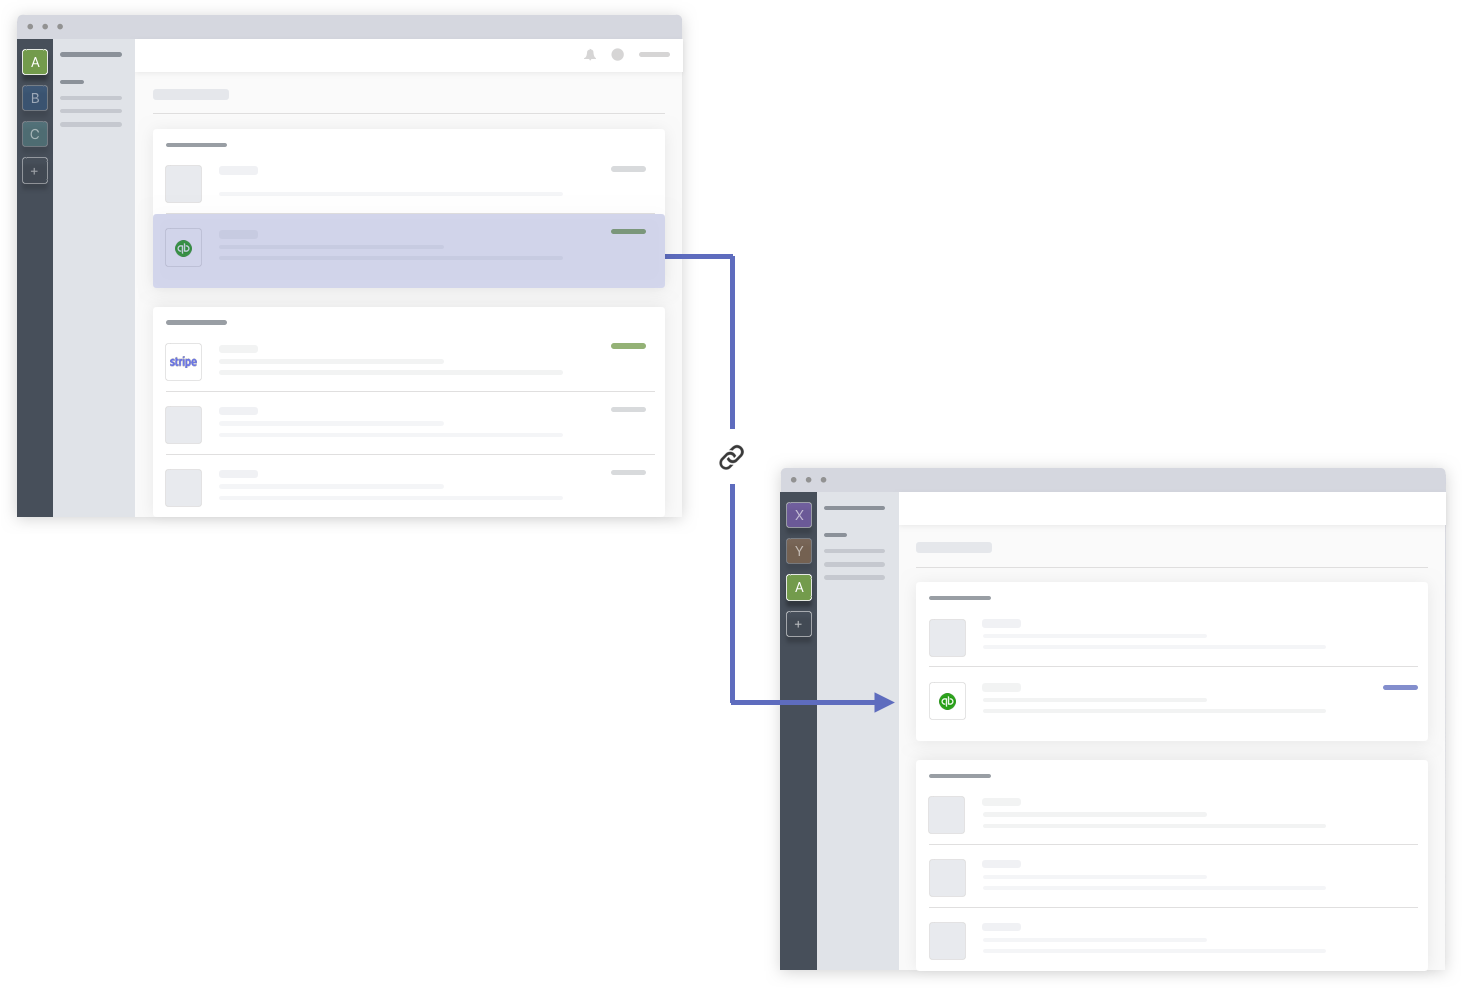
2. Use workspaces to organize data
Organize multi-location businesses under one organization, or share data connections with other organizations.
Workspaces organize integrated data sources or shared data connections. No technical expertise needed.

3. Consolidate as needed
Use consolidate and advisor workspaces to consolidate or aggregate data from multiple workspaces.
Monitoring a portfolio of companies? Analyzing performance of subsidiaries? No problem.
Workspaces give you total control over your data.
Malartu custom metrics allow you to build any calculation, from simple operations to complex functions, using any data source, shared connection, or upload. Blend data sources, leverage metric groupings, add static numbers - even build IF statements. Whatever you need to analyze your data.
Build new calculations with custom metrics


Customize templates for the perfect view

Use templates to start your build
Templates not only build out blocks and boards in seconds, they calculate all the necessary custom metrics for your analysis using your connected data sources.
Templates are designed for specific businesses by our expert community of business advisors.

Customize visualizations, adjust calculations, or build from scratch, all without code
Any block, board, or calculation in Malartu is editable. Use block options to configure your perfect view.
Analyze your data your way. Build dashboards fast, without getting your IT department involved.