
How to simplify your franchise business into a math problem
A few months back I was on a call with the CEO of a fast-growing franchise (they went from 15 to 65 units last year) to learn more about the franchise’s growing pains. We spoke about the customer experience, the exceptional franchisees they had attracted, and the operational challenges they’ve faced.
Then he capped off that intro with something I’ll always remember:
“Look, all franchises, no matter what they’re selling, boil down to two things: marketing and analytics. Franchisees provide the business acumen... the service... the product experience... we [the franchisor] provide the marketing and analytics. We’ve got the marketing down, now we need to build the analytics.”
Of course this lacks a bit of nuance, but I would imagine most franchisees and franchisors would agree with this statement.
We’re all familiar with the many ways to market your product or service, and there are great agencies that specialize in just this area. But what about the analytics side? How are franchises analytics companies? How are franchises organizing information to help franchisees better deliver their products or service?
The short answer is: They’re not. Yet.
The longer answer is: Both franchisors and franchisees have access to all the data they would need to operate as a data-driven company, but they’re not leveraging it to its full potential, and they’re not communicating what it means to be a data-driven company.

How to turn your business into a math problem
“Analytics” is a grossly overused and misunderstood word. As a founder at Malartu, a franchise analytics company, I readily admit I’ve added to this problem, so I also feel responsible to simplify it to one statement:
Every business, including franchises, boils down to a simple math problem: Revenue - Costs = Profit.
Are you ready to close this window and stop reading this article now or what?
“What a ridiculously obvious thing to write” - probably you right now.
But that’s the point, the world of analytics always boils down to understanding that one fundamental truth: are we making more money on our customers than it costs to acquire them?
The meat of this truth is in understanding your business’s unit economics. The key performance indicators we use to measure the unit economics of any business are:
Customer Acquisition Cost (CAC)
Customer Lifetime Value (LTV)
Every business can be boiled down to this relatively simple math problem if they have a deep understanding of
How much revenue they make per customer and
How much it costs to acquire that customer.
Calculating the ratio between the LTV and CAC of your business is how you simplify your business into a math problem. Once your business is a math problem, it becomes very clear what you need to do to improve it.
Let’s unpack what goes into CAC and LTV and how franchises might go about doing this.
Calculate the total value of each customer
Customer lifetime value is how much money you expect to make on each customer over the course of their time with your business. This is calculated differently depending if you’re a membership business model, or you’re reliant on individual purchase. For this post we’ll focus on membership models.
For membership models, LTV is calculated as:
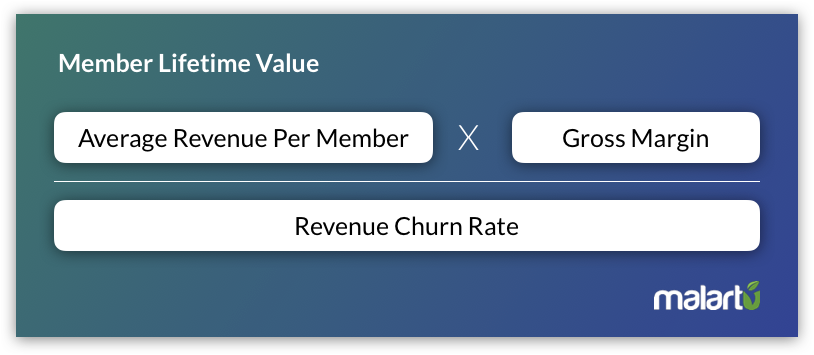
(Average Revenue per Member * Gross Margin) / (Churn Rate)
As you can see, there are two sides to this equation: Revenue (ARPM * Gross Margin) and retention (Churn Rate). Both are equally important in building a high customer value.
Customer Revenue Analysis
Your average revenue per member is largely dependent on your pricing, but it’s also dependent on your ability to upsell members.
As a franchisee, you may not have full control over your membership pricing, but you do have control over upselling tactics. For example, if your membership fees are fixed according to your franchisor, you obviously can’t raise the price significantly; however, you can bundle other products and services to raise your average revenue per member.
If you’re seeing your average revenue per member go up, it means your team is doing a good job upselling.
Gross margin is also heavily influenced by your franchisor, where materials and cost of services are regulated by specific suppliers. It’s worth looking into how you might leverage group buying with other franchisees if you have the opportunity, this is likely the best way to reduce cost of sales and increase gross margin.
A large part of increasing your customer lifetime value is to focus on each customer’s gross profit margin, but keeping your customers around is equally important. That brings us to your customer retention analysis.
Retention analysis
In your LTV calculation your denominator is churn, which is a measurement of how much money you lost in canceled or downgraded subscriptions. We analyze revenue churn as so:
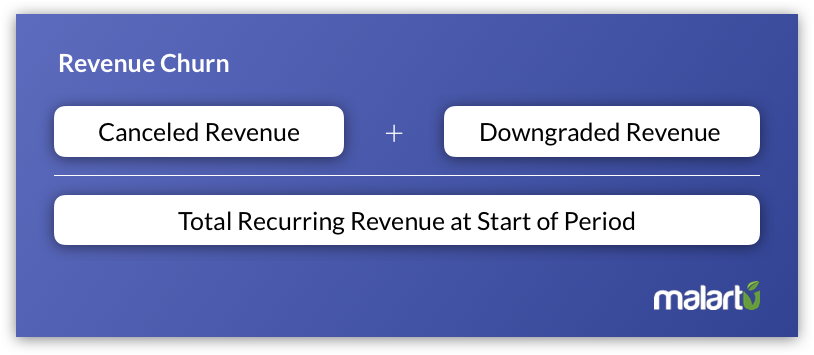
Canceled or Downgraded Revenue / Total Recurring Revenue at Start of Period
This calculation provides a high-level view of your churned revenue, but it doesn’t tell you exactly who is churning. Analyzing each and every member is too burdensome for the average membership business, so to analyze churns we split members into cohorts and run a cohort analysis.
Quick note on cohort analysis
Often businesses will split members into cohorts based on when they became a customer, but we also suggest you split customers by where they came from.
For example, you might analyze what % of customers that signed up in January are still with you in June, and then again in December. But you should also split up customers by which marketing channel they came from, such as Facebook Ads, Referrals, and Email Campaigns and monitor their retention over time.
What you will find is that not all customer acquisition channels are created equal, and customers that come from one channel might stick around longer than another. This is a very important insight to couple with our next analysis, Customer Acquisition Cost.
Calculate the cost to acquire each customer
With a deep understanding of our customer’s lifetime value, we now need to calculate how much it costs us to acquire them. Generally, we want to spend less to acquire a customer than they are worth over their lifetime, but in a perfect world customers should be worth 3X+ what we spend to acquire them. This affords us a high gross margin overall, leaving more money for fixed operating expenses and that family vacation you’ve been planning.
Customer Acquisition Cost is generally calculated as:
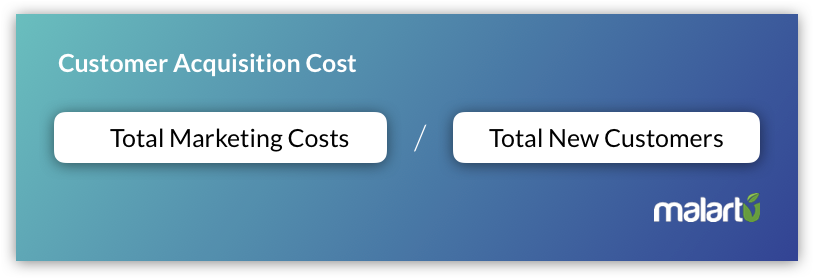
Total Marketing Costs / Total New Customers
Marketing costs should take into account your paid ads, email campaigns, marketing professionals, cost of trials, sales people, etc. Make sure to include all costs involved in customer acquisition, otherwise you will have a deflated view of how much you’re spending.
Quick note: CAC Payback
Understanding the cost of each customer is one thing, but you also want to know how long it takes you to recoup that cost so you don’t run out of cash. CAC Payback is calculated by:
CAC / (Average Revenue per Member * Gross Margin)
This is important to understand because businesses that have a low average revenue per member, but a high retention rate, may be able to spend more to acquire each customer but they need a strong cash position to run that campaign. Understanding that you need to float acquisition costs for 6-9 months before a customer is profitable might lead you to applying for a bank loan or a cash infusion from investors. This is a great growth strategy as long as you understand the CAC Payback Period.
Analytics gives you intel, benchmarking gives you context
After calculating the components needed for LTV and CAC, you will have a great insight into your business but you’ll still be wondering, “Is my LTV to CAC ratio of 3:1 good? Could I be doing better?” “Is my payback period of 6 months off mark?”
The answers to these questions lie in your broader franchise network. Benchmarking these KPIs gives you a perfect barometer for where you can improve or maintain.
This is what we do at Malartu. We work with franchisees to automate and deliver KPI insights, and we work with franchisors to benchmark those KPIs across the entire franchise. We provide crystal clear reports including CAC and LTV calculations, and we deliver them in beautiful dashboards.
To learn more about how we can do this at your franchise, connect with our team today.
