Aligning with Private Equity LPs through Better Portfolio Monitoring
At a recent alternative investment conference in Chapel Hill, NC, a major topic (maybe the major topic), was GP and LP alignment in private equity. This has been a topic of discussion since the rise of private equity in the 1980’s, and one that takes many shapes during the various market cycles. Nothing new, but undoubtedly a moving target.
The LP/GP Structure Has Its Issues
Generally, the LP is a passive partner in the management of the fund, where a GP must drive economic returns while aligning on various topics like risk, transparency, and impact initiatives. The success of the GP/LP model ultimately rests on both parties interest’s being aligned. Obviously, this is easier said than done.

In a 2013 article from the Harvard Corporate Governance Forum, Martin Steindl outlines a number of possible areas for LP misalignment:
- Economic misalignment
- Key man events
- GP’s taking too much risk
- GP’s not considering ESG related items
- Alignment of fiduciary duties
While Steindl notes a number of ways to mitigate misalignment of fiduciary duties, key man events, and risk through LP agreements, economic and ESG related misalignments require extra effort by GP’s to avoid.
Documenting Progress Toward Objectives
Maintaining this level of alignment initially requires a clear outline of expectations through properly structured fund documents; but, as the fund moves through its lifecycle, there must be a process for measuring progress toward objectives. Not just reporting on objectives annually.
This process requires collecting large amounts of data and translating it into reports that inform GPs and LPs alike. This regular reporting and increased transparency aligns limited partners as true partners and advisors who can deploy resources to help solve issues before they become major problems, just as a GP works to solve issues in portfolio companies. Additionally, a display of this understanding into the ebbs and flows of portfolio performance positions GP’s as going above and beyond their fiduciary duties.

Credit: https://ilpa.org/
There are obvious benefits to this level of reporting, but piling on more data and reporting requirements puts a strain on the limited resources of both GP and LP operating teams. Fulfilling the basic recommended reporting items outlined by the ILPA offers enough challenges and administrative work for operations teams. Raising this level of transparency requires technology and automation.
The Case for Data Aggregation and Reporting Software
Given the administrative burden of managing too many GP relationships, some of the largest LPs are reducing the number of GP relationships they maintain. According to a 2012 survey conducted by Preqin, approximately 21% of LPs surveyed expected to reduce the number of GP relationships they maintain due to increased administrative burdens and allocating more capital to high-performing funds.
This begs the question: how do you strengthen your alignment with your LP’s while decreasing their administrative burden?
Through a true software solution.
Realizing the Opportunity in New Technology
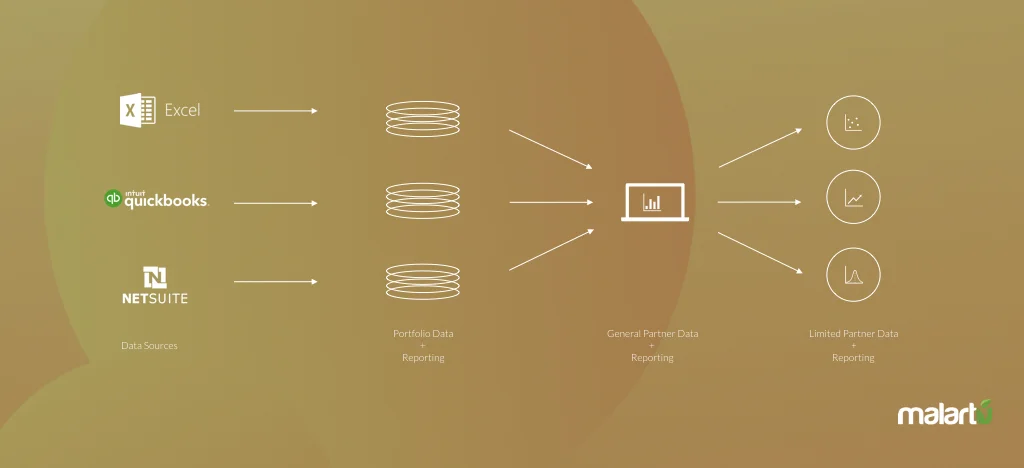
By reimagining the way you collect financial and operational data from portfolio companies you can ease the administrative burden for teams involved in reporting and analytics from, portfolio company to LP, and collect much more data.
Many existing reporting systems are rigid and require a major overhaul to add new data points like specific operational KPIs for each company in your portfolio. Chances are, your portfolio executives are tracking these KPIs internally. The information simply isn’t shared freely enough to inform GP’s and LP’s acting as a companies advisor.
Tell the Whole Story
A small example of this predicament is when a GP makes sales team performance a top initiative for a particular quarter or year. Adding sales data to a monthly, quarterly, or annual report that outlines efforts to get gross revenue back on track is a major undertaking. What’s the ratio of sales professionals to full-time employees? How effective are they as a team? How many calls do they make that results in a positive outcome? These metrics are far too cumbersome for the manual processes and analyst workloads of yesterday.
Malartu can not only extract data from existing reports but generate new data sets from programs companies use to run day-to-day through API connections and integrations.
Another example: Say you need to measure fuel costs by delivery trucks in an underperforming distributor. Cutting down on carbon emissions may be a major ESG initiative set by a few of your LP’s. Decreasing fuel costs is a major line item you’re looking to improve in an effort to turn around performance. Collecting that level of operational data is difficult for your operations teams. On top of that, it might only be an ESG initiative set by a handful for your LP’s, requiring a slightly more detailed LP report for some, and a more general overview for others.
By connecting directly to this company’s ERP system to better understand fuel spend, you can automate the collection of this information. By leveraging Malartu, you can create specific reports for specific LP’s with less effort than you would spend on a single report before.
In our next post, we will discuss the challenges and benefits to solving the LP reporting, “One-to-many” problem described above: when different LPs require different data sets in their quarterly or annual reporting.